Kelvin Zeng

WashingtonFishHarvest
Fishing is one of the few things my dad and I bond over. Washington, being the perfect near-ocean state, would be a great candidate in analyzing the types of fish and the population trends of those fish breeds.
I’ve downloaded the public access data of fish harvest record from 1974 to 2012 on data.gov
I then skimmed through the data to see what I can answer with this dataset with the following columns:
Year
Fisher Type (Sport, Treaty, or non-Treaty).
Fish Type (Chinook, Coho, Chum, Pink, Sockeye, Steelhead, Jacks)
Total amount by fisher type
Total amount by the year
Questions
- Are fishes available each year declining from overharvesting?
- What is the difference between treaty catcher and non-treaty catcher?
- Which specie is more sustainable/ caught the most each year?
Hypothesis
I’ve notice that seafood prices in general have been increasing in the sound which suggests the availability of seafood is decreasing over the years from overharvesting and not allowing the population to regenerate back to a health threshold. So I would expect to see a decrease in all species of fish harvested.
Analysis
First let’s see the total amount of fish caught per year throughout the timeline.
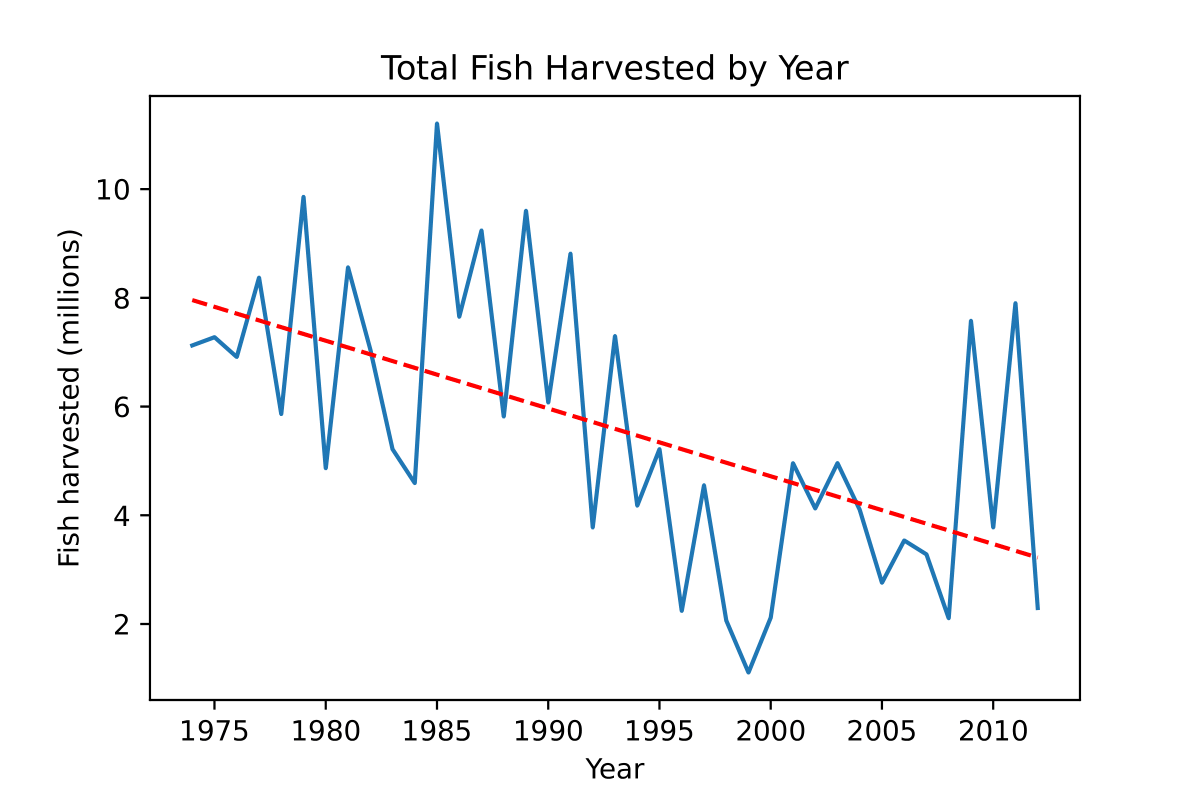 It seems like from the the start of this datset, fish harvest has been incremental up until the early 90s. For the next decade, harvest have been rapidly declining suggesting a overharvesting, it wasn’t until the mid 2000s do we see recovery of fish harvest. One interesting note I may add is that the recovery state could have been due to advancement and tighter restrictions in both buisness and recreational harvesting in hope to preserve specie populations.
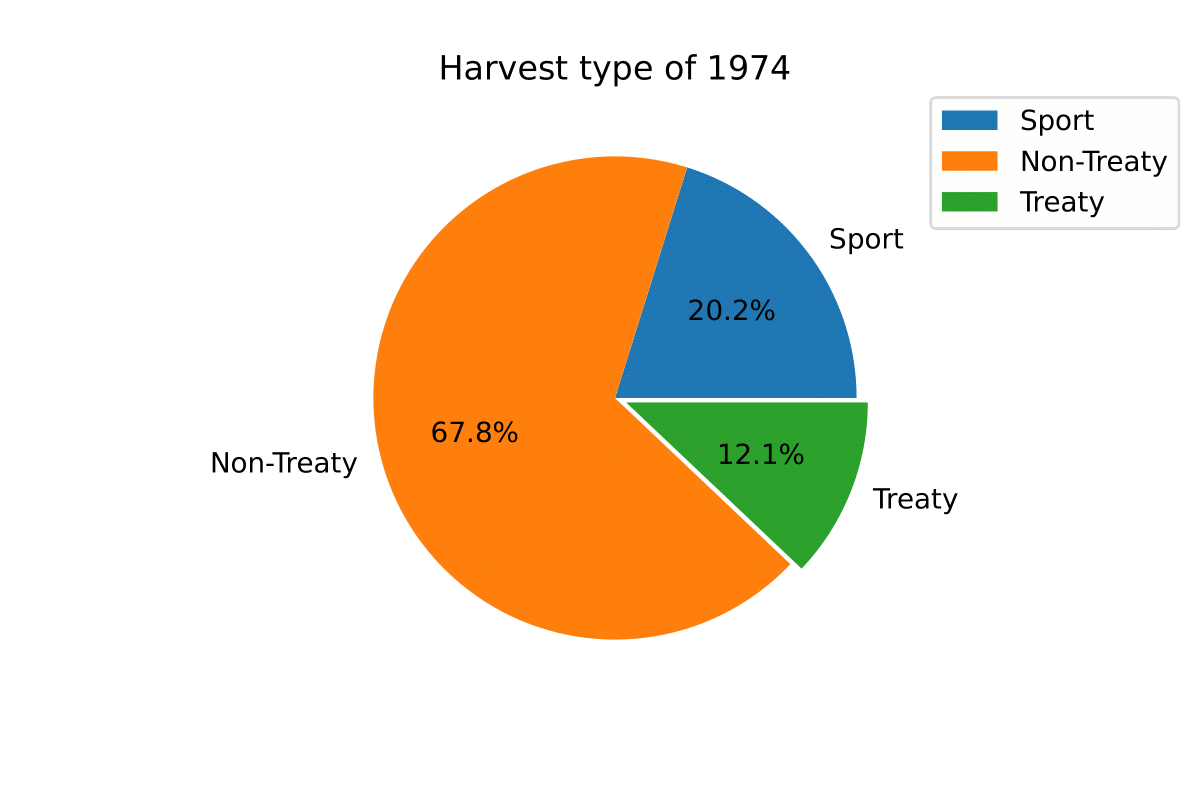
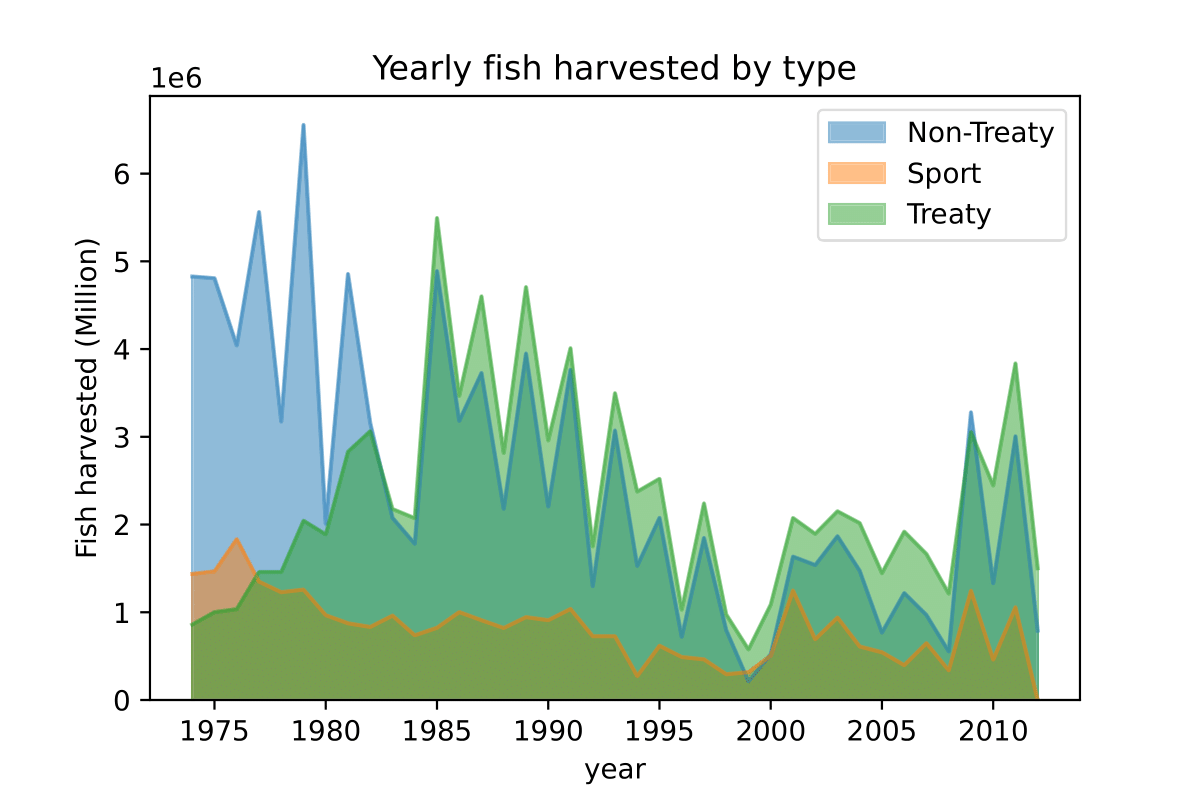
Next let’s explore the fish caught grouped by fisher type. There are three types of fishers categorized in the dataset(Sport, Treaty, non-Treaty). I understood the Sport catagory from professional fishing scene, but I did not know about the differences on treaty and untreaty. So I looked it up and interestingly, in 1974 Washington state signed a treaty known as the Boldt decision that entitled native Indians to 50% of the fish in the state for their own use. Source Therefore, any non-treaty harvest would be commercial and personal use.
Since the treaty started in 1974, coincidentally, the dataset begun from the same year, I expect to see a increase in Treaty harvest amount.
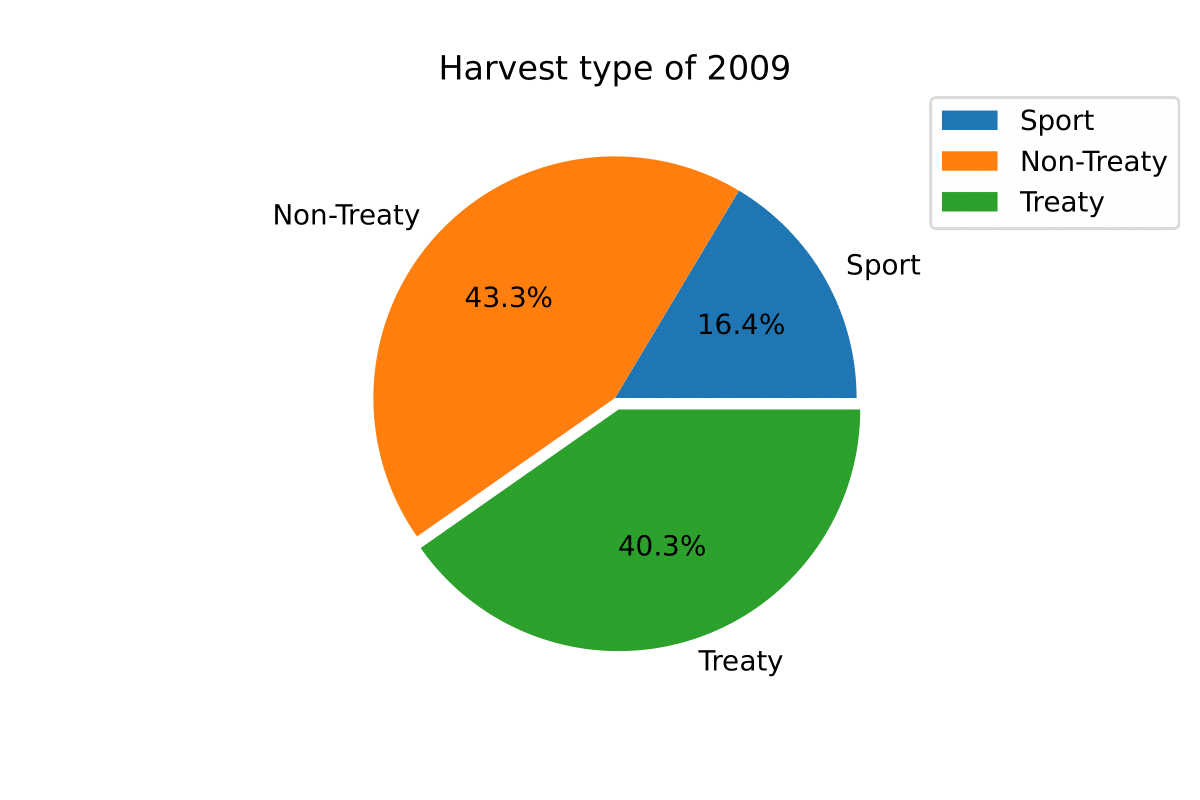
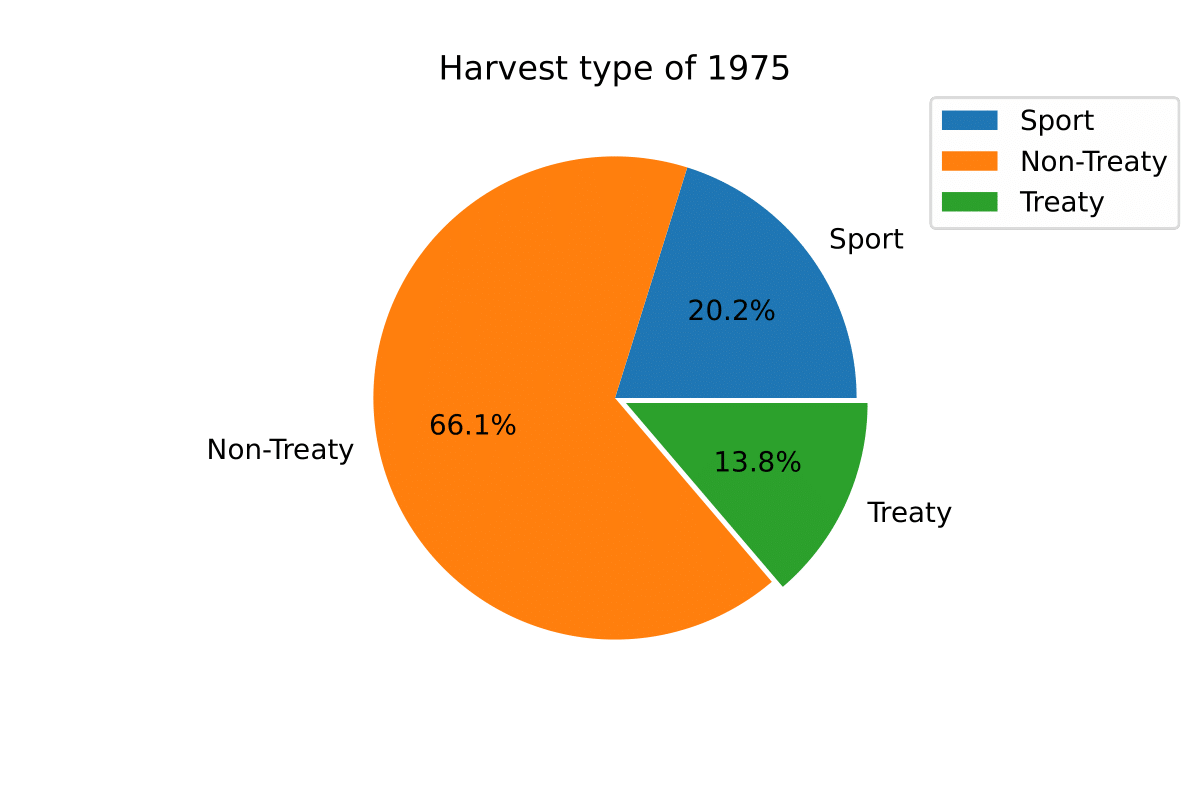
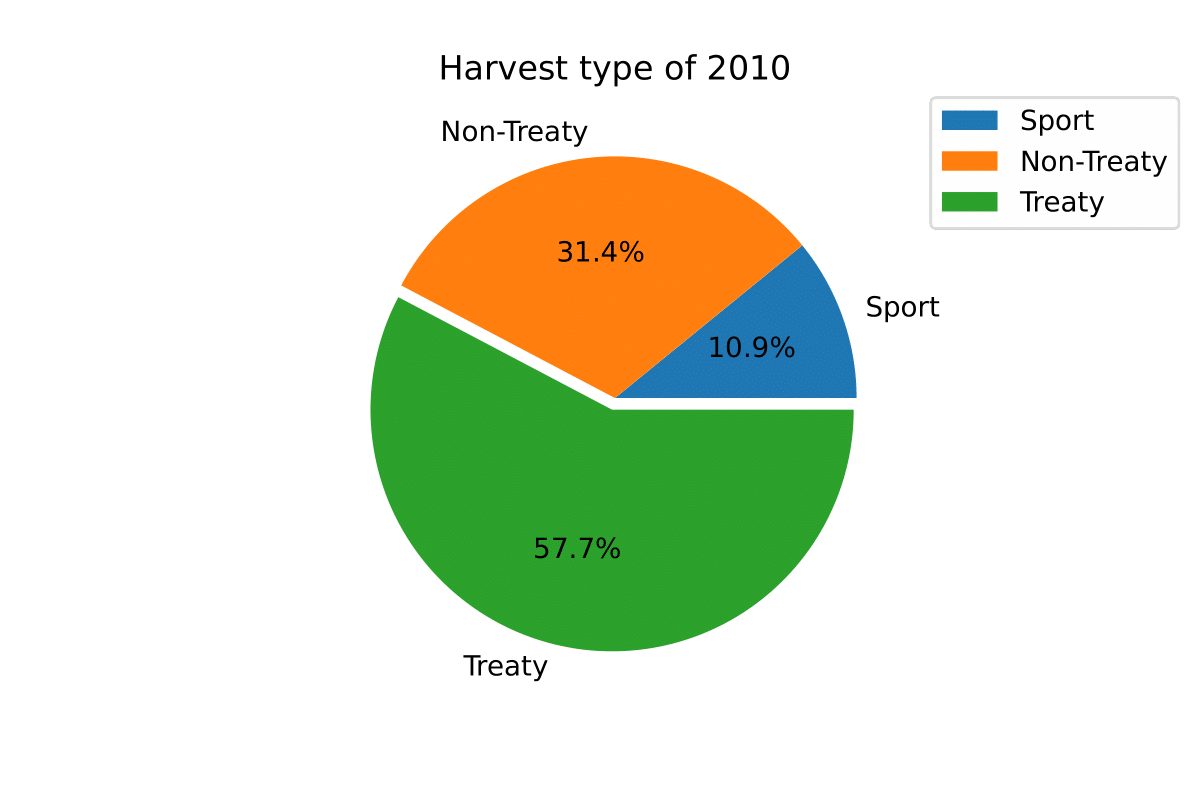
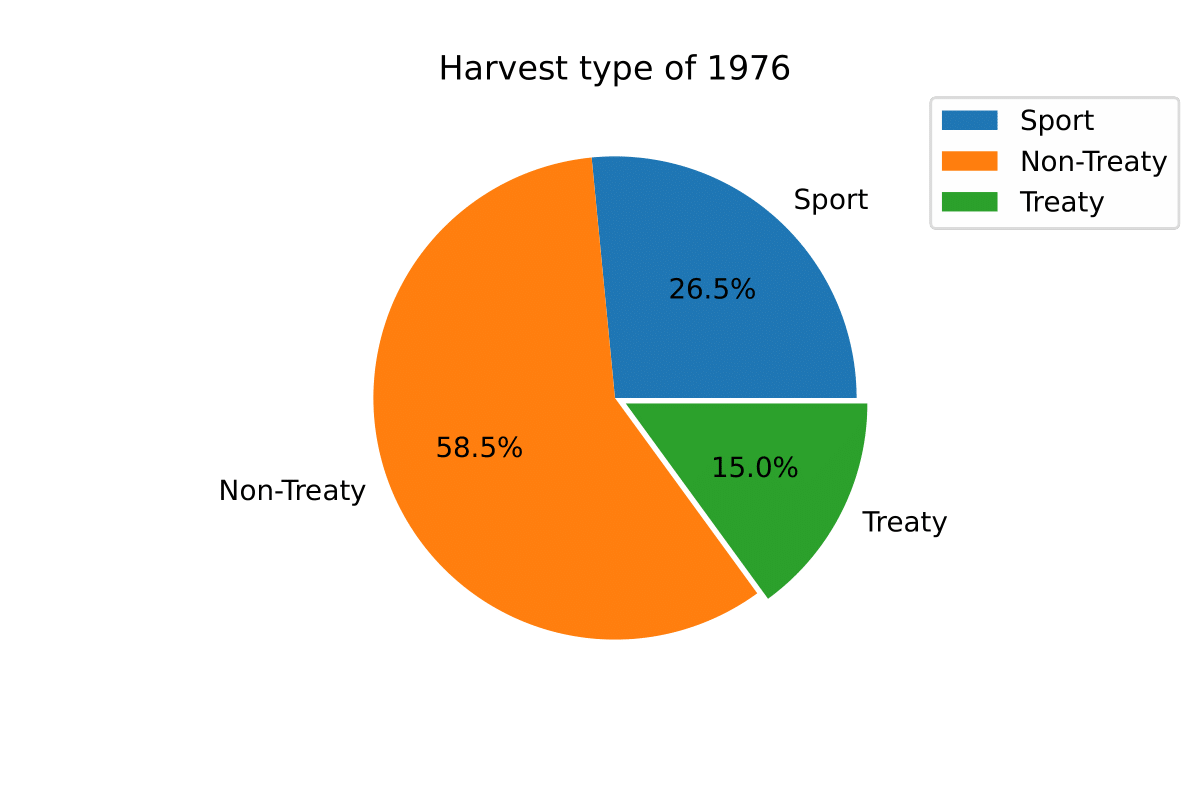
| First 3 Years | Last 3 Years |
|---|---|
 |
 |
 |
 |
 |
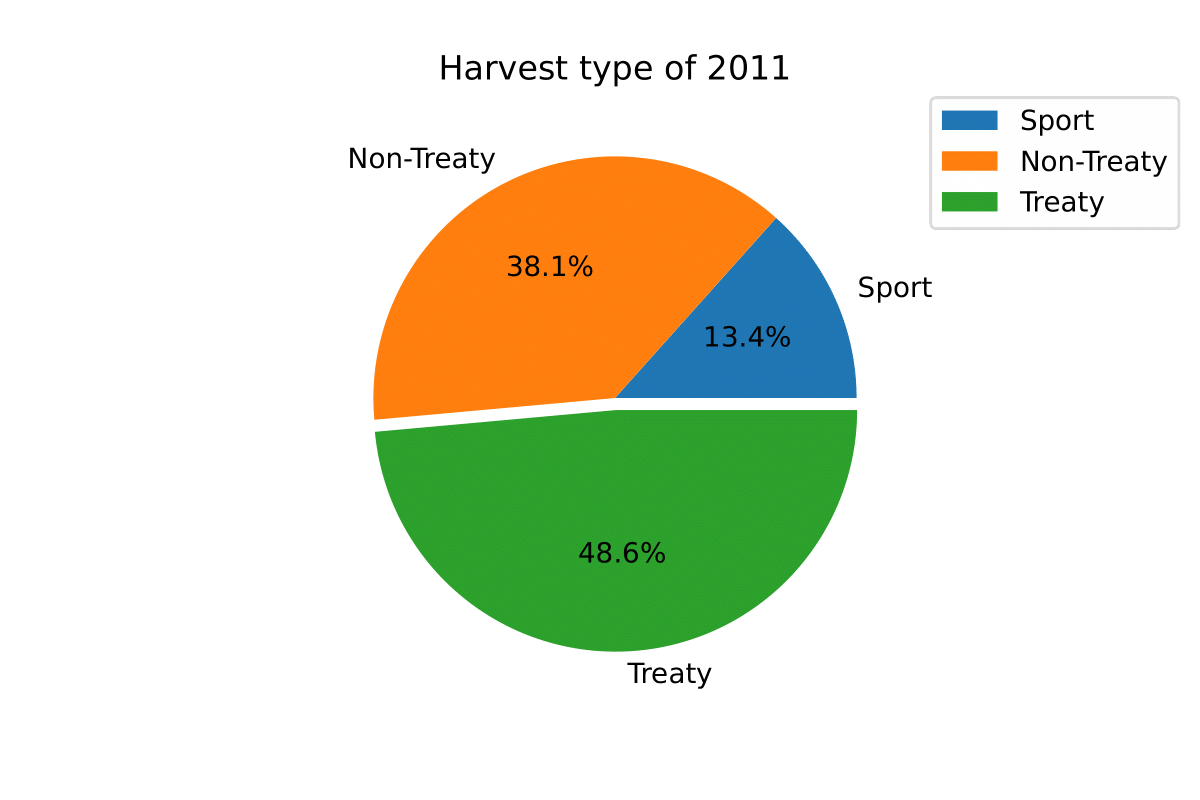 |
As predicted, treaty harvest exponentially increased over the year looking at the first three year and last three years of the given dataset. Even surpassing non-treaty harvest while Sport stays relatively stable. This result could tell us that majority of fish on the market were harvested from native Indian owned operations today.
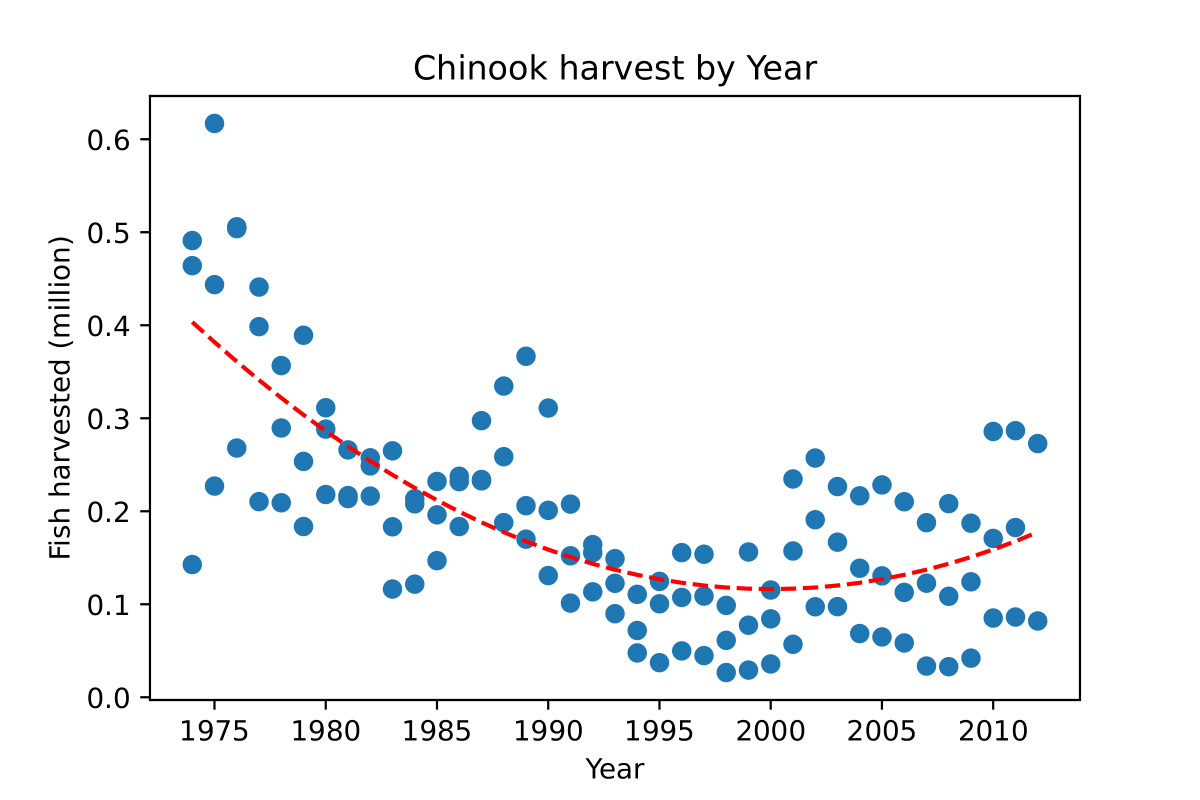
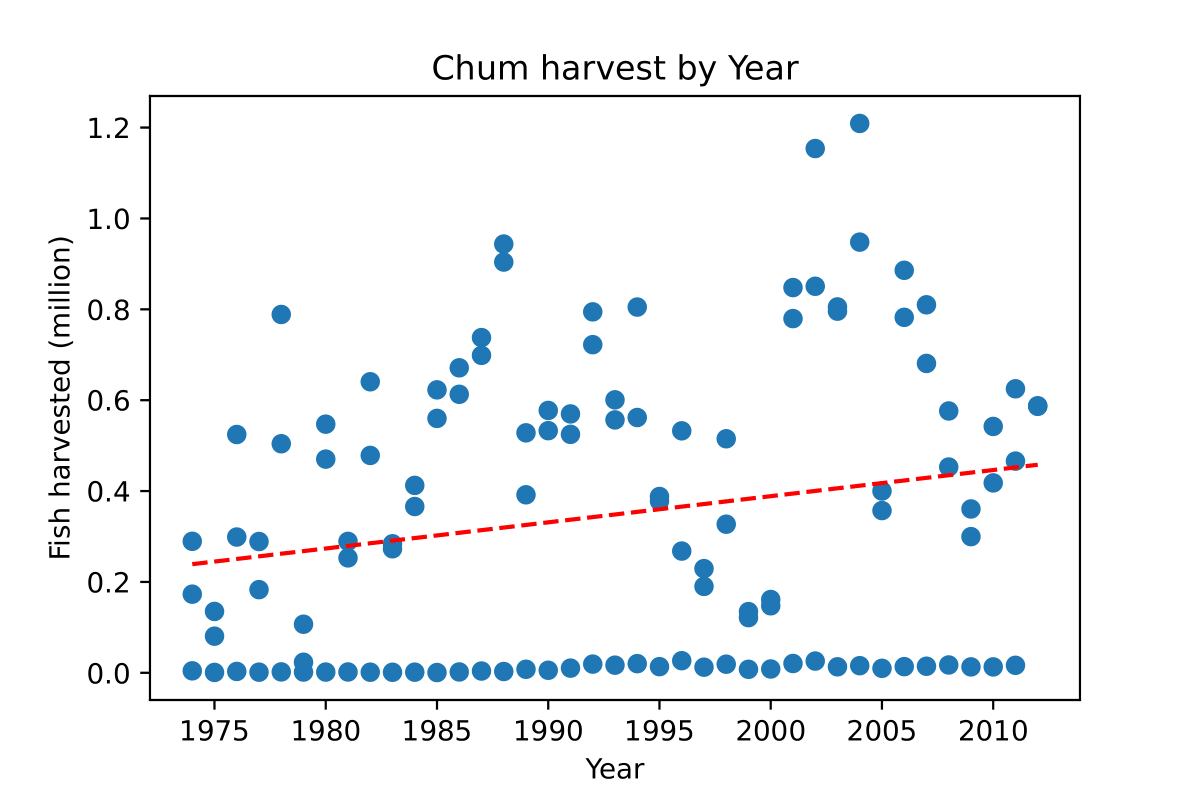
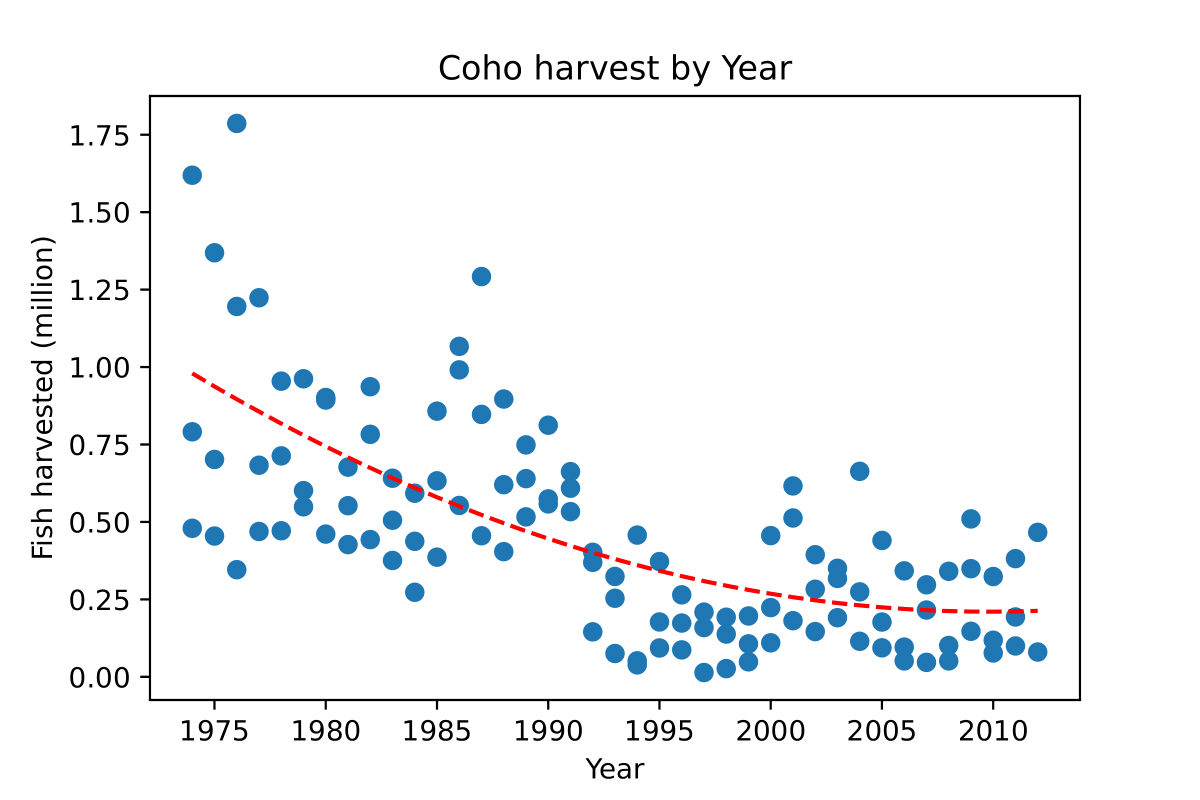
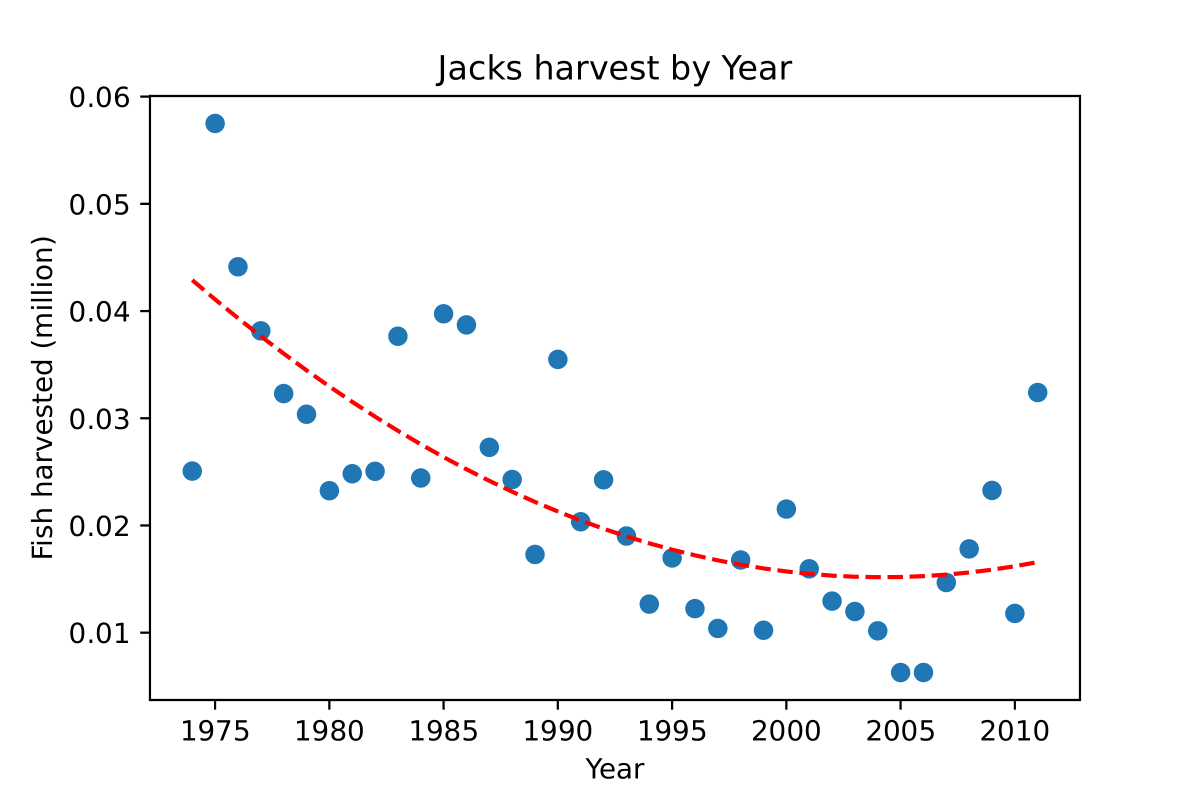
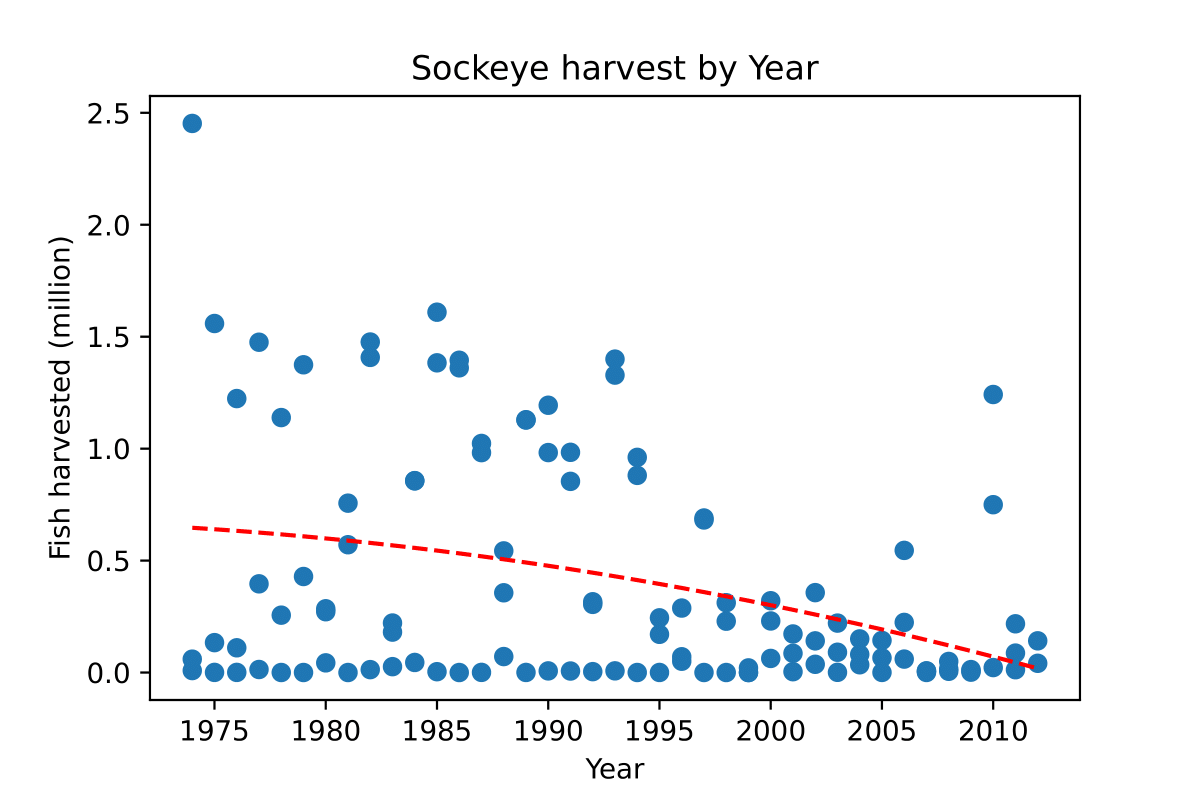
Lastly, I want to look at the harvest record by fish species.
| Species | Species |
|---|---|
 |
 |
 |
 |
|
 |
|
Overall, we do see a downward trend for all the species of fish harvested over the years. One note I need to add is that the plot includes all three fisher types harvested that year, the sports catagory almost exclusively harvest Jacks and Steelhead while not very many on other species making the trend line less reliable, however, the trend line is still prominant enough to show a deteriorating harvest amount and population of all species. So I like to urge the general public who enjoys seafood and occasioanl fishing trips to follow the WDFD guidelines and not overharvesting.